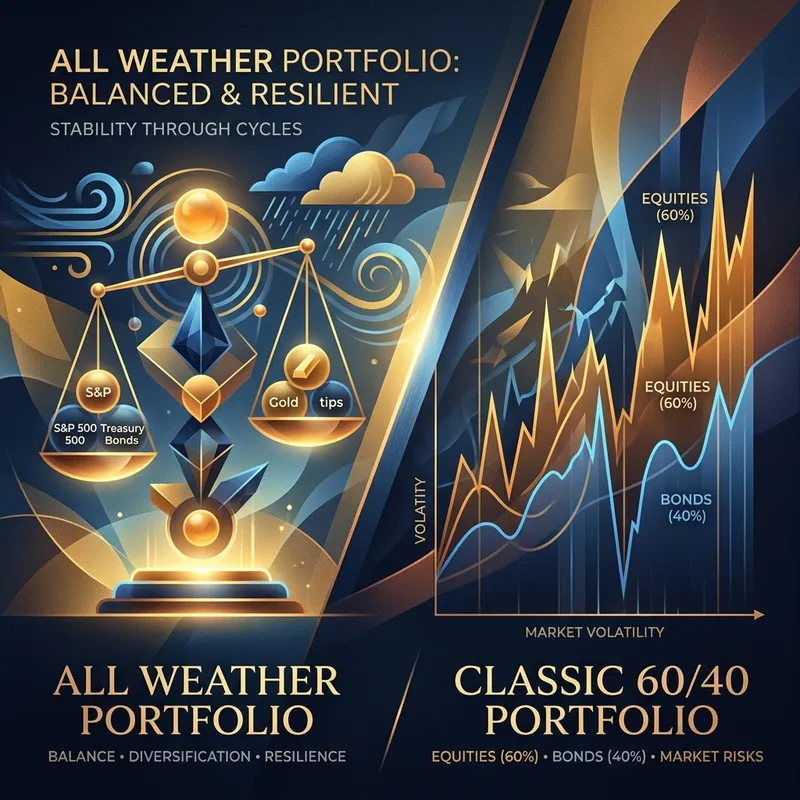
For decades, the classic 60/40 portfolio (60% equities, 40% bonds) served as the standard benchmark for balanced investing. However, the inflation shock of 2022, which saw both stocks and bonds decline simultaneously, exposed severe structural cracks in this traditional layout.
Enter Ray Dalio's All Weather Portfolio. Built on risk-parity principles, this allocation structure aims to balance risk rather than capital weight. How do they compare, and which reigns supreme?
The Classic 60/40 Asset Distribution
The 60/40 is designed for simplicity. It assumes equities will provide long-term growth while high-quality bonds act as a cushion during market corrections.
- 60% Equities: Driven by corporate earnings, captures economic growth.
- 40% Fixed Income: Traditional safe-haven assets yielding coupon income and diversifying equity drawdown.
The Problem: Although capital is divided 60/40, stocks are roughly three times more volatile than bonds. In terms of risk contribution, equities account for over 90% of the portfolio's total volatility. When stocks crash, bonds must rally significantly to offset the losses.
Ray Dalio's All Weather Portfolio
Bridgewater's "All Weather" approach is designed around the idea that we cannot predict the future, but we do know there are four economic environments ("seasons"):
- Rising Growth (inflation stable or falling)
- Falling Growth (deflation/recession)
- Rising Inflation
- Falling Inflation
Dalio allocates assets specifically to perform in each season:
- 30% Stocks (SPY/VOO): For rising growth.
- 40% Long-Term Treasuries (TLT): For falling growth / deflation.
- 15% Intermediate-Term Treasuries (IEF): For moderate safety.
- 7.5% Gold (GLD): For rising inflation / currency devaluation.
- 7.5% Commodities (PDBC): For rising inflation and supply shocks.
"By balancing the risk weights of different assets, you can achieve a portfolio that is significantly more stable without sacrificing long-term growth." — Ray Dalio
The Head-to-Head Comparison
Historically, the 60/40 portfolio slightly outperforms the All Weather in CAGR (Compound Annual Growth Rate) during massive, decades-long equity bull markets. But this outperformance comes at a cost:
- Drawdowns: The 60/40 suffered a maximum drawdown of over -20% during the 2008 Financial Crisis and the 2022 Inflation Drop. The All Weather max drawdown was limited to roughly -12%.
- Sharpe Ratio: The All Weather typically boasts a higher Sharpe Ratio (risk-adjusted returns), showing it delivers more consistent returns per unit of volatility.
Conclusion: Which Strategy Wins?
The answer depends entirely on your risk tolerance and investment timeline. If you are young, can handle volatility, and have a 20+ year horizon, the 60/40 or a 100% equity portfolio will likely build more wealth. However, if you are nearing retirement or prioritize capital preservation above all else, the All Weather Portfolio is the clear champion, offering a smooth ride across any economic season.
Ready to apply this strategy?
Take the next step by exploring our free interactive tools, live allocations, and calculators.